Simulating a scanning-3DXRD dataset#
python -m anri.simulate simulates a scanning-3DXRD dataset from a map, as ImageD11 files that ImageD11 and python -m anri.index read. It runs in three stages, each writing one file that the next one reads:
Stage |
What it does |
Options |
What the plots show |
|---|---|---|---|
|
map entries per phase, reflections and structure factors, the beam’s spreads, the scan’s motor positions |
|
the sample against the rows’ reach; each ring’s share of the detector |
|
rows of the scan rendered into sparse pixels above the segmentation cut; rows can be split between jobs ( |
|
how peaks survive the cut at each density; how much of each peak its window holds |
|
the rendered rows gathered into an ImageD11 dataset ( |
|
a rendered row, summed over its frames |
This notebook runs the same stages, with the plots that help choose each option (anri.simulate.diagnostics and anri.simulate.plots). The files it writes are the command line’s, with the same provenance, and it ends with the python -m anri.simulate run command that remakes them.
By default it renders the AM-like 316L phantom shipped in tests/data/phantoms/am316l (38 grains with misoriented cells and twin lamellae, 0.5 µm voxels), on an Eiger 4M at 43.6 keV with ID11’s Al CRLs: 57 rows of 1 µm, 1800 frames of 0.1°. The render takes about two minutes on a GPU, so this notebook is stored with its outputs and not re-run when the docs are built. With interactive = True (the default when you run it), sliders redraw the plots, and the value on a
slider is what the later cells use; it needs ipywidgets, ipympl and matplotlib.
[1]:
# Parameters: the options of python -m anri.simulate. The sliders below start from these values.

map_file = None  # an ImageD11 TensorMap (.h5) or python -m anri.index's _entries.npz; None: the AM316L phantom
pars_file = None  # ImageD11 geometry (.par or pars.json); None: the Eiger 4M geometry below
cif = None  # --cif: one path, or {phase name: path} (None: |F|^2 = 1)
# instrument
optics = "al-crl"  # --optics: "al-crl" or "si-nanolens" (ID11's focusing optics: the beam's convergence)
divergence = None  # --divergence: the convergence's sigma (rad) instead of the optics'
bandwidth = 2e-3  # --bandwidth: FWHM of dlambda/lambda (ID11's Laue monochromator)
beam_fwhm = None  # --beam-fwhm (None: the dty step)
psf = 0.5  # --psf: detector point spread (sigma, pixels)
det_shape = (2162, 2068)  # --det-shape: an Eiger 4M
# scan
y0 = 0.0  # --y0
omega_range = (0.0, 180.0)  # --omega-range
omega_step = 0.1  # --omega-step
dty_step = 1.0  # --dty-step (None: the map's voxel size)
margin = 3.0  # --margin: rows cover the sample and this many beam FWHM either side
tth_max = None  # --tth-max (None: the largest ring wholly on the detector)
density = 30.0  # --density: counts per unit density
# rendering
cut = 1.0  # --cut: keep counts above this: the threshold your segmentation used on the data you mimic
window = (3, 7, 7)  # --window: frames, slow, fast
max_frames = 31  # --max-frames

analysisroot = None  # where the ImageD11 dataset goes (None: a temporary folder)
sample, dataset = "am316l", "sim"
outdir = None  # where the stage files go (None: analysisroot)
n_cpu = 4  # --n-cpu

# this notebook only
interactive = True  # sliders (ipympl); False: static figures at the parameters' values, as stored in the docs
probe = None  # rows rendered to look at counts and windows (None: the middle row and one through the sample's edge)
[2]:
import anri.utils

anri.utils.setup(n_cpu=n_cpu)  # before any JAX computation

import os
import tempfile
import time
from types import SimpleNamespace

import ipywidgets as widgets
import numpy as np
from IPython import get_ipython
from IPython.display import display
from matplotlib import pyplot as plt

import anri.io
import anri.simulate as sim
from anri.simulate import diagnostics as dg
from anri.simulate import plots as pl

get_ipython().run_line_magic("matplotlib", "widget" if interactive else "inline")
T0 = time.time()
NOTEBOOK = "rendering_parameters.ipynb"  # recorded as the command in each stage file's provenance


def log(msg):
    print(f"[{time.time() - T0:7.1f} s] {msg}", flush=True)


def figure(name, **kwargs):
    plt.close(name)
    with plt.ioff():
        fig = plt.figure(name, layout="constrained", **kwargs)
    if interactive:
        fig.canvas.header_visible = False
    return fig


def show(fig):
    display(fig.canvas if interactive else fig)


def interact(fig, update, **controls):
    # sliders that call a plot's update, which redraws it and returns a summary; their values are in .kwargs
    if not interactive:  # draw once at the controls' starting values
        values = {k: c.value for k, c in controls.items()}
        print(update(**values))
        display(fig)
        return SimpleNamespace(kwargs=values)
    w = widgets.interactive(lambda **kw: print(update(**kw)), **controls)
    display(w, fig.canvas)
    return w


def slider(value, lo, hi, step, name):
    return widgets.FloatSlider(value=value, min=lo, max=hi, step=step, description=name, continuous_update=False,
                               readout_format=".3g")
The map and the geometry#
The map is an ImageD11 TensorMap (every phase in it is rendered; each needs a space-group number) or the populations the indexer writes (_entries.npz), so a map indexed from data can be rendered back and compared with the data. The geometry is an ImageD11 .par file (or pars.json); for the phantom, an Eiger 4M 150 mm from the sample at 43.6 keV.
[3]:
if map_file is None:
    map_file = os.path.join("..", "..", "..", "tests", "data", "phantoms", "am316l", "am316l_tmap.h5")
if analysisroot is None:
    analysisroot = tempfile.mkdtemp()
outdir = outdir or analysisroot
if pars_file is None:
    pars_file = os.path.join(outdir, "geometry.par")
    anri.io.imaged11.write_par(pars_file, {
        "y_center": 1049.9, "y_size": 75.0, "tilt_y": 0.0, "z_center": 1116.5, "z_size": 75.0, "tilt_z": 0.0,
        "tilt_x": 0.0, "distance": 150e3, "o11": -1, "o12": 0, "o21": 0, "o22": -1, "wavelength": 0.2843,
        "wedge": 0.0, "chi": 0.0,
    })
stem = os.path.join(outdir, os.path.splitext(os.path.basename(map_file))[0])
prepare_options = {"cif": cif, "optics": optics, "divergence": divergence, "bandwidth": bandwidth,
                   "beam_fwhm": beam_fwhm, "psf": psf, "y0": y0, "omega_range": omega_range, "omega_step": omega_step,
                   "dty_step": dty_step, "margin": margin, "density": density, "det_shape": det_shape,
                   "tth_max": tth_max}


def prepare(**changed):
    prepare_options.update(changed)
    return sim.stages.stage_prepare(map_file, pars_file, f"{stem}_prepare.h5", **prepare_options, command=NOTEBOOK, log=log)


prepare_file = prepare()
p = sim.stages.load_prepare(prepare_file)
[    1.7 s] map ../../../tests/data/phantoms/am316l/am316l_tmap.h5: 1 phase(s), voxel 0.5, sample radius 25; scan 57 rows of 1 x 1800 frames of 0.1 deg; beam FWHM 1, convergence 8e-05 rad (al-crl), bandwidth 0.002 FWHM; 2theta up to 26.75 deg
[    2.0 s] phase 316L: 7845 entries, 180 reflections, |F|^2 = 1
[    2.0 s] -> /tmp/tmptmq4lznu/am316l_tmap_prepare.h5
1. The scan: --dty-step, --margin, --beam-fwhm#
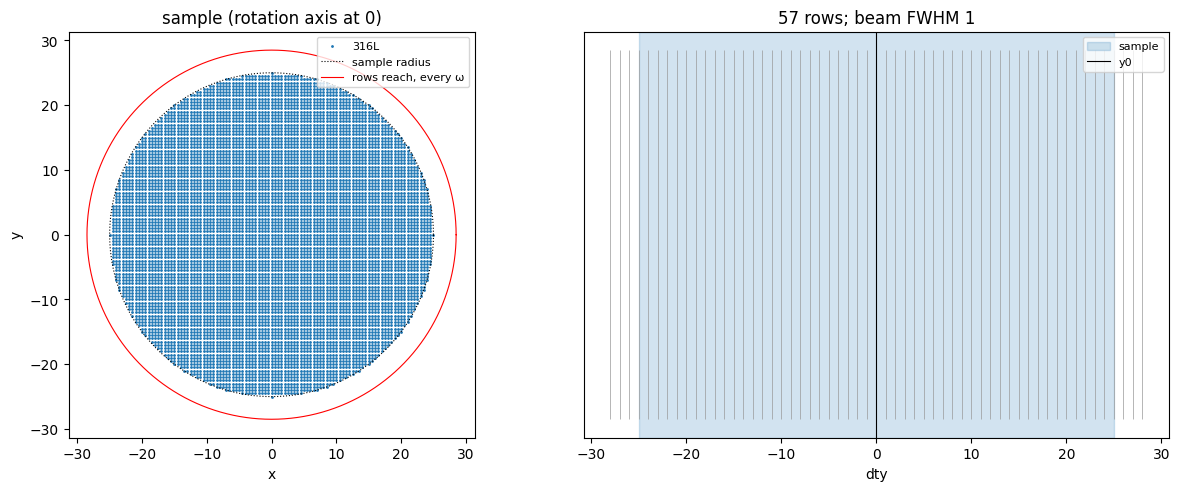
The rows run across the sample in steps of dty_step (usually the beam’s FWHM at ID11), and reach margin beam widths beyond it on either side, so that the sample’s edge is seen with the whole beam profile. Every voxel should lie inside the red circle: the radius the rows reach at every ω. Fewer, wider rows render faster but blur the sample across dty, as a wider beam would.
[4]:
fig = figure("footprint", figsize=(12, 4.8))
pl.plot_footprint(fig, dg.footprint(p))
show(fig)
2. Reflections: --tth-max#
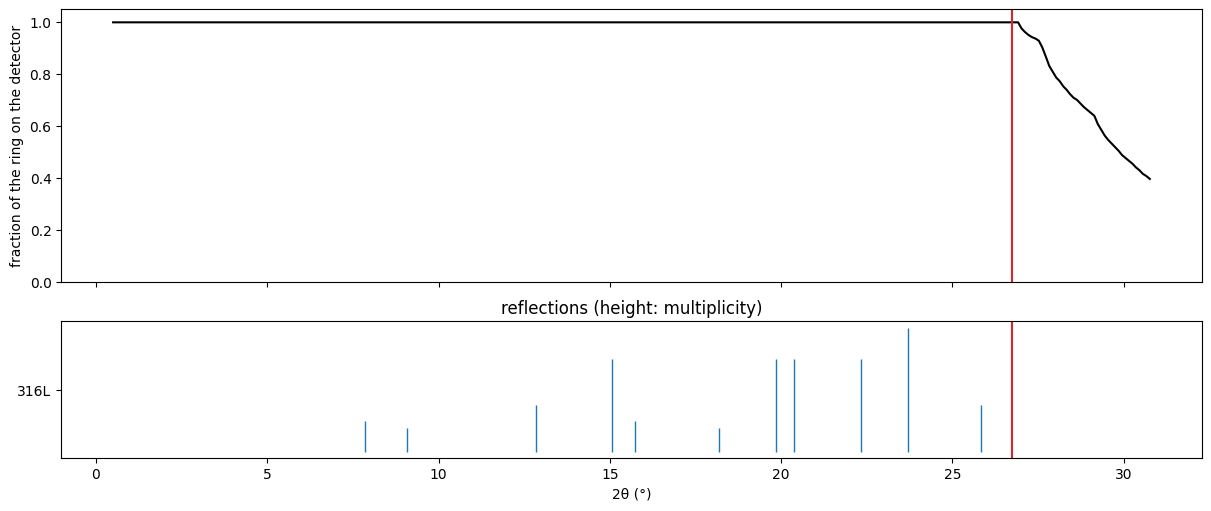
Spots on a ring that runs off the detector are lost wherever they leave it, which an indexer cannot tell from a weak reflection. By default the reflections stop at the largest ring wholly on the detector (top: the fraction of each ring on it, traced from the sample). Lower tth_max to render fewer, faster; the rings are re-prepared below if it moves.
[5]:
cov = dg.ring_coverage(p)
fig = figure("rings", figsize=(12, 5))
w_tth = interact(fig, pl.plot_rings(fig, cov), tth_max=slider(cov["tth_max"], 2.0, float(cov["tth"][-1]), 0.05,
                                                                "tth_max"))
tth_max 26.75 deg: reflections 316L: 180; 100% of the outermost ring on the detector
[6]:
if not np.isclose(w_tth.kwargs["tth_max"], cov["tth_max"]):
    prepare_file = prepare(tth_max=w_tth.kwargs["tth_max"])
    p = sim.stages.load_prepare(prepare_file)
print(f"tth_max {p['prov']['resolved']['tth_max']:.2f} deg; reflections per phase: "
      + ", ".join(f"{n}: {len(h)}" for n, (_, h, _) in zip(p["names"], p["phases"])))
tth_max 26.75 deg; reflections per phase: 316L: 180
3. Counts: --density#
ImageD11’s segmentation keeps only pixels above a cut, so the faint ends and tails of a peak are missing from real data, and the renderer applies the same cut: set cut to the threshold your segmentation used on the data you mimic. What then matters is how bright the peaks are against it, which density sets (counts per unit density, i.e. per voxel of full density).
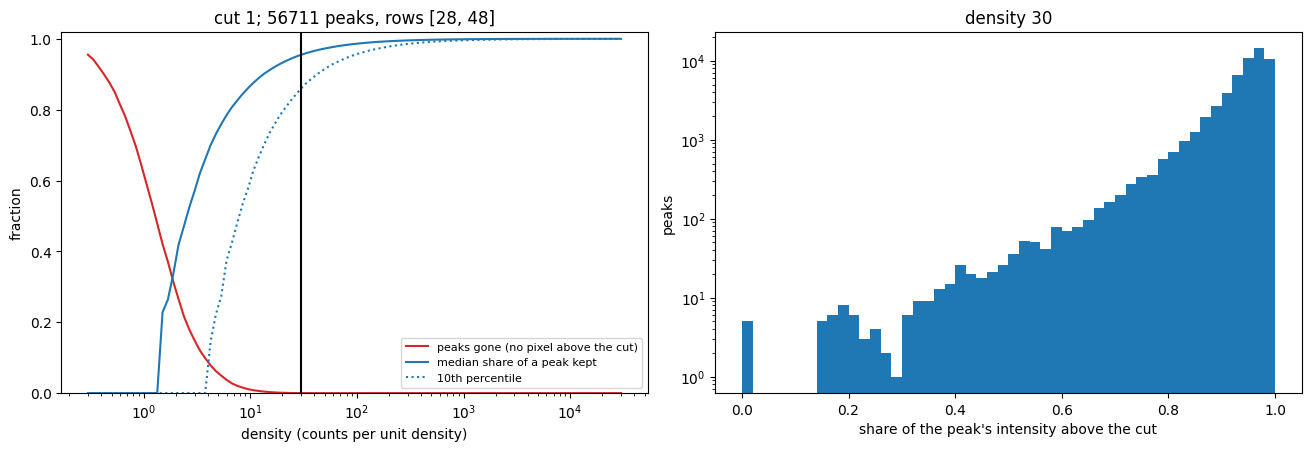
A few rows are rendered here without writing them: the middle row and one through the sample’s edge. Each peak is judged in the row that sees its voxel best, against the row’s summed pixels (overlapping peaks count). Intensities scale with the density, so one render gives every density. Look for the density where peaks stop disappearing (left, red): below it, whole weak reflections and the peaks of small or thin features (twins, cells at a grain’s edge) are gone from the data, as they would be from a weak measurement; well above it, only the faint ends of each peak are cut (blue: the share of a peak’s intensity that survives, and right, at the slider’s density).
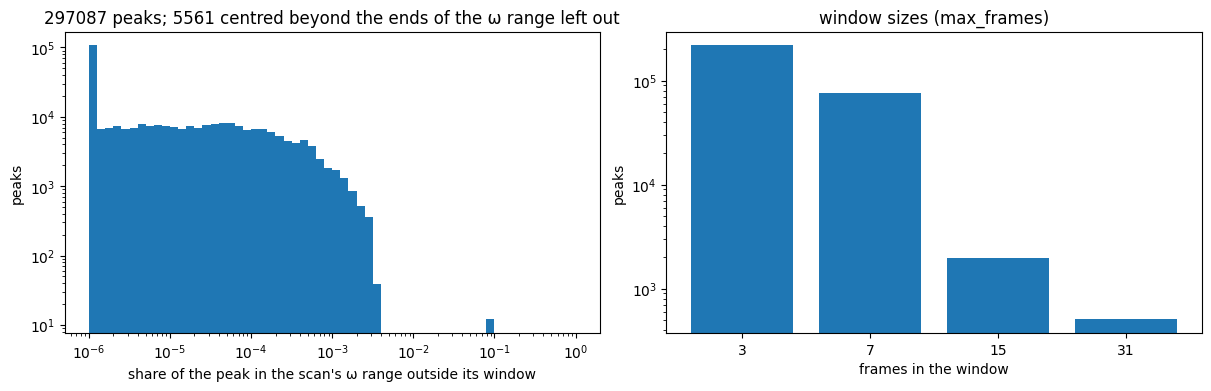
Windows (--window, --max-frames): each peak is rendered into a window of frames and pixels around it, so the share of a peak left outside its window is lost. Peaks broad in ω (near η = 0 and 180°, or with an orientation spread) get windows of more frames, up to max_frames. The plot shows, for each peak centred in the scan, the share of its profile within the scan’s ω range that its window misses: what a scan loses at its own ends is not counted against the window. Peaks centred
just beyond the ends (the selection reaches as far as the widest window, so a broad one there can still reach the scan) are counted separately; their Friedel mates, 180° away, are in the scan. On the phantom, the dozen peaks that lose ~10% are the broadest, in the widest window: max_frames = 63 holds them all to within 0.4%, at some cost in time.
[7]:
if probe is None:
    mid = p["omega"].shape[0] // 2
    edge = int(np.argmin(np.abs(p["dty"][:, 0] - (p["prov"]["options"]["y0"] + 0.8 * p["prov"]["resolved"]["sample_radius"]))))
    probe = [mid, edge]
probed = dg.probe_rows(p, probe, cut, window, max_frames, log=log)
fig = figure("survival", figsize=(13, 4.4))
w_density = interact(fig, pl.plot_survival(fig, probed), density=widgets.FloatLogSlider(
    value=p["prov"]["options"]["density"], base=10, min=-1, max=4, step=0.05, description="density",
    continuous_update=False))
fig = figure("capture", figsize=(12, 3.8))
pl.plot_capture(fig, probed)
show(fig)
[   74.2 s] row 28: 184843 peaks, 35535 of them judged here (70.6 s)
[   83.5 s] row 48: 117805 peaks, 21176 of them judged here (9.3 s)
density 30: 0.0% of the peaks gone; a peak keeps 95% of its intensity (median), 86% (10th percentile)
[8]:
density_used = w_density.kwargs["density"]
if not np.isclose(density_used, p["prov"]["options"]["density"]):
    prepare_file = prepare(density=density_used)
    p = sim.stages.load_prepare(prepare_file)
print(f"density {density_used:g}, cut {cut:g}")
density 30, cut 1
4. Render and assemble#
Every row of the scan, every phase summed, written above the cut. Rows are independent: on a cluster, split them between jobs with python -m anri.simulate render <prepare file> --rows a:b (one file per job), then assemble gathers every part made from the prepare file, and refuses if a row is missing or twice. Here it is one job.
[9]:
render_file = sim.stages.stage_render(prepare_file, cut=cut, window=window, max_frames=max_frames, command=NOTEBOOK,
                              log=log)
assemble_file = sim.stages.stage_assemble(prepare_file, analysisroot, sample, dataset, command=NOTEBOOK, log=log)
[   84.9 s] rendering rows 0..56 of 57, 1 phase(s)
[   85.0 s] row 0 (dty -28): 0 peaks (0 outside the omega range), 0 pixels above 1, window capture >= 1.0000 (0.0 s)
[  100.4 s] row 1 (dty -27): 5436 peaks (37 outside the omega range), 0 pixels above 1, window capture >= 0.9979 (15.4 s)
[  116.7 s] row 2 (dty -26): 16831 peaks (148 outside the omega range), 68 pixels above 1, window capture >= 0.9972 (16.3 s)
[  117.0 s] row 3 (dty -25): 31599 peaks (331 outside the omega range), 12378 pixels above 1, window capture >= 0.9970 (0.3 s)
[  117.3 s] row 4 (dty -24): 49150 peaks (580 outside the omega range), 30560 pixels above 1, window capture >= 0.9957 (0.3 s)
[  117.7 s] row 5 (dty -23): 69084 peaks (869 outside the omega range), 41531 pixels above 1, window capture >= 0.9957 (0.4 s)
[  118.1 s] row 6 (dty -22): 90956 peaks (1238 outside the omega range), 50722 pixels above 1, window capture >= 0.9957 (0.5 s)
[  118.6 s] row 7 (dty -21): 106985 peaks (1569 outside the omega range), 57864 pixels above 1, window capture >= 0.9957 (0.5 s)
[  119.1 s] row 8 (dty -20): 119543 peaks (1883 outside the omega range), 66025 pixels above 1, window capture >= 0.9957 (0.5 s)
[  119.5 s] row 9 (dty -19): 130079 peaks (2102 outside the omega range), 73764 pixels above 1, window capture >= 0.9957 (0.5 s)
[  120.0 s] row 10 (dty -18): 139338 peaks (2236 outside the omega range), 78757 pixels above 1, window capture >= 0.9957 (0.5 s)
[  120.5 s] row 11 (dty -17): 147359 peaks (2311 outside the omega range), 85700 pixels above 1, window capture >= 0.9958 (0.5 s)
[  121.0 s] row 12 (dty -16): 153927 peaks (2346 outside the omega range), 90198 pixels above 1, window capture >= 0.9968 (0.5 s)
[  121.4 s] row 13 (dty -15): 159317 peaks (2354 outside the omega range), 94373 pixels above 1, window capture >= 0.9914 (0.5 s)
[  121.9 s] row 14 (dty -14): 163497 peaks (2337 outside the omega range), 96100 pixels above 1, window capture >= 0.9914 (0.5 s)
[  122.4 s] row 15 (dty -13): 166799 peaks (2366 outside the omega range), 97239 pixels above 1, window capture >= 0.9912 (0.5 s)
[  122.9 s] row 16 (dty -12): 169472 peaks (2432 outside the omega range), 98532 pixels above 1, window capture >= 0.8582 (0.5 s)
[  123.4 s] row 17 (dty -11): 171656 peaks (2520 outside the omega range), 100391 pixels above 1, window capture >= 0.8582 (0.5 s)
[  123.9 s] row 18 (dty -10): 173883 peaks (2683 outside the omega range), 102332 pixels above 1, window capture >= 0.4392 (0.5 s)
[  124.4 s] row 19 (dty -9): 175999 peaks (2844 outside the omega range), 103105 pixels above 1, window capture >= 0.4392 (0.5 s)
[  125.0 s] row 20 (dty -8): 177850 peaks (3022 outside the omega range), 104872 pixels above 1, window capture >= 0.4392 (0.6 s)
[  125.5 s] row 21 (dty -7): 179175 peaks (3217 outside the omega range), 105598 pixels above 1, window capture >= 0.4392 (0.6 s)
[  126.1 s] row 22 (dty -6): 180319 peaks (3448 outside the omega range), 104406 pixels above 1, window capture >= 0.4392 (0.6 s)
[  126.7 s] row 23 (dty -5): 181430 peaks (3644 outside the omega range), 106072 pixels above 1, window capture >= 0.4392 (0.6 s)
[  127.2 s] row 24 (dty -4): 182014 peaks (3809 outside the omega range), 107285 pixels above 1, window capture >= 0.4392 (0.6 s)
[  127.8 s] row 25 (dty -3): 182648 peaks (3872 outside the omega range), 109127 pixels above 1, window capture >= 0.4392 (0.6 s)
[  128.4 s] row 26 (dty -2): 183491 peaks (3993 outside the omega range), 108850 pixels above 1, window capture >= 0.9032 (0.6 s)
[  129.1 s] row 27 (dty -1): 183914 peaks (3957 outside the omega range), 107413 pixels above 1, window capture >= 0.9032 (0.7 s)
[  129.4 s] row 28 (dty 0): 184843 peaks (3818 outside the omega range), 107732 pixels above 1, window capture >= 0.9032 (0.2 s)
[  129.9 s] row 29 (dty 1): 185172 peaks (3691 outside the omega range), 108811 pixels above 1, window capture >= 0.9032 (0.6 s)
[  130.5 s] row 30 (dty 2): 185208 peaks (3623 outside the omega range), 109726 pixels above 1, window capture >= 0.9656 (0.6 s)
[  131.1 s] row 31 (dty 3): 185013 peaks (3604 outside the omega range), 112526 pixels above 1, window capture >= 0.9656 (0.6 s)
[  131.7 s] row 32 (dty 4): 184809 peaks (3618 outside the omega range), 114339 pixels above 1, window capture >= 0.7732 (0.6 s)
[  132.3 s] row 33 (dty 5): 183452 peaks (3630 outside the omega range), 116391 pixels above 1, window capture >= 0.7732 (0.6 s)
[  132.9 s] row 34 (dty 6): 181751 peaks (3496 outside the omega range), 114574 pixels above 1, window capture >= 0.7732 (0.6 s)
[  133.5 s] row 35 (dty 7): 179972 peaks (3380 outside the omega range), 111245 pixels above 1, window capture >= 0.7732 (0.6 s)
[  134.1 s] row 36 (dty 8): 177940 peaks (3259 outside the omega range), 107309 pixels above 1, window capture >= 0.7732 (0.5 s)
[  134.6 s] row 37 (dty 9): 175817 peaks (3139 outside the omega range), 104670 pixels above 1, window capture >= 0.7732 (0.5 s)
[  135.1 s] row 38 (dty 10): 173398 peaks (2993 outside the omega range), 101589 pixels above 1, window capture >= 0.7732 (0.5 s)
[  135.6 s] row 39 (dty 11): 170355 peaks (2958 outside the omega range), 99924 pixels above 1, window capture >= 0.7732 (0.5 s)
[  136.1 s] row 40 (dty 12): 167266 peaks (2871 outside the omega range), 95855 pixels above 1, window capture >= 0.7732 (0.5 s)
[  136.6 s] row 41 (dty 13): 163595 peaks (2785 outside the omega range), 93928 pixels above 1, window capture >= 0.9967 (0.5 s)
[  137.1 s] row 42 (dty 14): 159300 peaks (2654 outside the omega range), 91845 pixels above 1, window capture >= 0.9968 (0.5 s)
[  137.6 s] row 43 (dty 15): 154234 peaks (2504 outside the omega range), 90493 pixels above 1, window capture >= 0.9966 (0.5 s)
[  138.0 s] row 44 (dty 16): 148927 peaks (2376 outside the omega range), 86598 pixels above 1, window capture >= 0.9966 (0.5 s)
[  138.5 s] row 45 (dty 17): 143042 peaks (2232 outside the omega range), 82438 pixels above 1, window capture >= 0.9967 (0.5 s)
[  139.0 s] row 46 (dty 18): 135937 peaks (2091 outside the omega range), 79092 pixels above 1, window capture >= 0.9966 (0.5 s)
[  139.5 s] row 47 (dty 19): 127589 peaks (1930 outside the omega range), 74723 pixels above 1, window capture >= 0.9967 (0.5 s)
[  139.7 s] row 48 (dty 20): 117805 peaks (1743 outside the omega range), 66305 pixels above 1, window capture >= 0.9966 (0.2 s)
[  140.1 s] row 49 (dty 21): 105967 peaks (1556 outside the omega range), 59740 pixels above 1, window capture >= 0.9303 (0.5 s)
[  140.6 s] row 50 (dty 22): 90191 peaks (1367 outside the omega range), 53089 pixels above 1, window capture >= 0.9303 (0.5 s)
[  141.0 s] row 51 (dty 23): 68560 peaks (1063 outside the omega range), 44856 pixels above 1, window capture >= 0.9303 (0.4 s)
[  141.3 s] row 52 (dty 24): 48920 peaks (754 outside the omega range), 33369 pixels above 1, window capture >= 0.9303 (0.3 s)
[  141.6 s] row 53 (dty 25): 31498 peaks (474 outside the omega range), 13415 pixels above 1, window capture >= 0.9303 (0.3 s)
[  141.9 s] row 54 (dty 26): 16835 peaks (240 outside the omega range), 33 pixels above 1, window capture >= 0.9303 (0.3 s)
[  142.0 s] row 55 (dty 27): 5444 peaks (57 outside the omega range), 0 pixels above 1, window capture >= 0.9303 (0.1 s)
[  142.0 s] row 56 (dty 28): 0 peaks (0 outside the omega range), 0 pixels above 1, window capture >= 1.0000 (0.0 s)
[  142.0 s] -> /tmp/tmptmq4lznu/am316l_tmap_render.h5 (57 s)
[  142.1 s] 1 part(s), 57 rows, 4407877 pixels -> /tmp/tmptmq4lznu/am316l/am316l_sim/am316l_sim_sparse.h5, /tmp/tmptmq4lznu/am316l/am316l_sim/am316l_sim_dataset.h5, /tmp/tmptmq4lznu/pars/pars.json
[  142.2 s] -> /tmp/tmptmq4lznu/am316l_tmap_assemble.h5
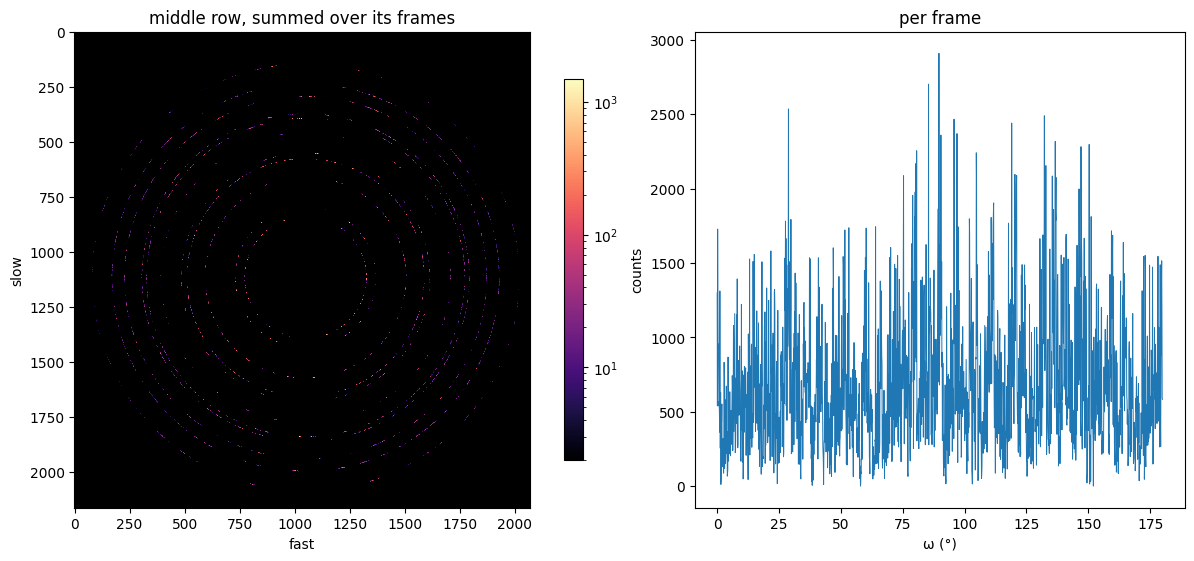
The middle row of the dataset written, summed over its frames (the Debye-Scherrer rings of spots), and the counts per frame.
[10]:
sparse_file = anri.io.provenance.read_provenance(assemble_file)["resolved"]["sparse_file"]
fig = figure("row", figsize=(13, 5.5))
pl.plot_row_image(fig, dg.row_image(sparse_file, p["omega"].shape[0] // 2), "middle row, summed over its frames")
show(fig)
The command line, and the files#
The python -m anri.simulate run command that remakes the dataset with every option chosen (anri.simulate.stages.run_command), then how the assemble file was made (anri.io.provenance.show, as python -m anri.simulate show). The dataset can go straight to the indexing parameters notebook (analysisroot, sample, dataset) or to python -m anri.index.
[11]:
print(sim.stages.run_command(assemble_file), end="\n\n")
print(anri.io.provenance.show(assemble_file))
python -m anri.simulate run /home/esrf/james1997a/Code/Anri/tests/data/phantoms/am316l/am316l_tmap.h5 /tmp/tmptmq4lznu/geometry.par /tmp/tmptmq4lznu am316l sim --bandwidth 0.002 --density 30.0 --det-shape 2162 2068 --dty-step 1.0 --margin 3.0 --omega-range 0.0 180.0 --omega-step 0.1 --optics al-crl --pol-factor 1.0 --psf 0.5 --y0 0.0 --batch 65536 --cut 1.0 --max-frames 31 --window 3 7 7

[prepare]
file = '/tmp/tmptmq4lznu/am316l_tmap_prepare.h5'
anri_version = '0.1.0'
command = 'rendering_parameters.ipynb'
cwd = '/home/esrf/james1997a/Code/Anri/docs/source/tutorials'
date = '2026-10-12T16:32:00+02:00'
git_commit = 'a28af32265a15aa47fa5f6e1c90af8b7c25794b3'
git_dirty = True
id = 'd04238ef0e494ce3a25c0e6a4e2e16eb'

[prepare.options]
bandwidth = 0.002
density = 30.0
det_shape = [2162, 2068]
dty_step = 1.0
map = '/home/esrf/james1997a/Code/Anri/tests/data/phantoms/am316l/am316l_tmap.h5'
margin = 3.0
omega_range = [0.0, 180.0]
omega_step = 0.1
optics = 'al-crl'
pars = '/tmp/tmptmq4lznu/geometry.par'
pol_factor = 1.0
psf = 0.5
y0 = 0.0

[prepare.resolved]
beam_fwhm = 1.0
divergence = 8e-05
dty_step = 1.0
n_frames = 1800
n_rows = 57
phases = ['316L']
sample_radius = 25.0
sig_beam = 0.42466090014400953
sig_wavelength = 0.00024146218782188385
tth_max = 26.750388608579332
voxel_size = 0.5
wavelength = 0.2843

[assemble]
file = '/tmp/tmptmq4lznu/am316l_tmap_assemble.h5'
anri_version = '0.1.0'
command = 'rendering_parameters.ipynb'
cwd = '/home/esrf/james1997a/Code/Anri/docs/source/tutorials'
date = '2026-10-12T16:34:21+02:00'
git_commit = 'a28af32265a15aa47fa5f6e1c90af8b7c25794b3'
git_dirty = True
id = '2f0468ef21ec4673bd9205d5e5da5be5'
source = '/tmp/tmptmq4lznu/am316l_tmap_prepare.h5'
source_id = 'd04238ef0e494ce3a25c0e6a4e2e16eb'

[assemble.options]
analysisroot = '/tmp/tmptmq4lznu'
dataset = 'sim'
peaks_table = False
sample = 'am316l'

[assemble.resolved]
dataset_file = '/tmp/tmptmq4lznu/am316l/am316l_sim/am316l_sim_dataset.h5'
parfile = '/tmp/tmptmq4lznu/pars/pars.json'
part_ids = ['3b47d0c5260f4e2eaee672bdfa697d94']
parts = ['/tmp/tmptmq4lznu/am316l_tmap_render.h5']
sparse_file = '/tmp/tmptmq4lznu/am316l/am316l_sim/am316l_sim_sparse.h5'

[assemble.results]
pixels = 4407877
rows = 57